Machine Learning 101 — my first look
Machine Learning and Artificial Intelligence are hardly new topics in computer science, but were thrust into the mainstream following announcements at last week's Google I/O. With the maturing smartphones market the big tech companies are looking to new areas of growth; big data, IoT and AI.
This blog is going to take a look at a technical example of Machine learning. We will use Google’s open source TensorFlow and the Softmax Regression to examine how to train a model that can look at handwritten digits to predict what they are. Simple right? If you're more interested in the business side @marcoarment published a great blog a few days ago: https://marco.org/2016/05/21/avoiding-blackberrys-fate
MNIST Dataset
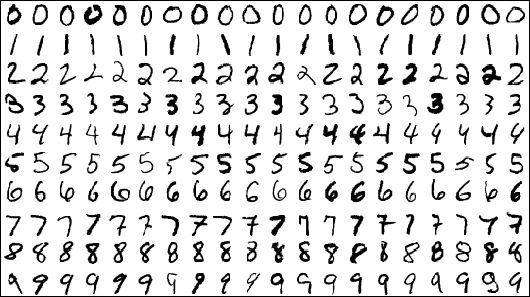
MNIST (Mixed National Institute of Standards and Technology database) is a database of handwritten digits:

The data can be downloaded from http://yann.lecun.com/exdb/mnist/
With any Machine learning, in order to later measure the ability to learning training data and test data must be kept separate. The MNIST data is split into:
• 60,000 data points for training images and 60,000 labels
• 10,000 data points for testing images and 10,000 labels
train-images-idx3-ubyte.gz: training set images (9912422 bytes)
train-labels-idx1-ubyte.gz: training set labels (28881 bytes)
t10k-images-idx3-ubyte.gz: test set images (1648877 bytes)
t10k-labels-idx1-ubyte.gz: test set labels (4542 bytes)
The Images
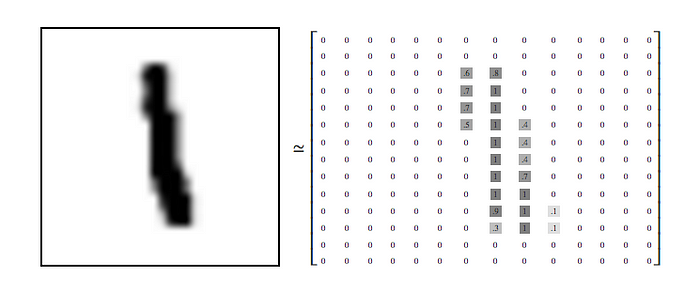
Every image is 28x28 pixels. We can convert these images into a 28 by 28 2D array giving us 784 points. Each point contains a pixel intensity value for its equivalent pixel. 0 equals white, 1 equals black.

If we take these 784 points across our entire training images (60,000 images) we can create a 2D array [60000, 784] which holds our entire training data.
The Labels
The labels downloaded above are a vector representation of how each images maps to a number between 0 to 9. For example, 3 would be [0,0,0,1,0,0,0,0,0,0] while 9 would be [0,0,0,0,0,0,0,0,0,1].
Again we can build a 2D array for our 60,000 training data points to give us an [60000, 10] array of floats.
TensorFlow implementation of Softmax Regressions
The overall aim is to look at any single digit and assign a percentage of its probability being a said number.
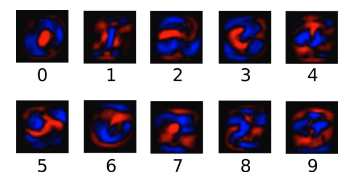
Using the 60,000 data points each holding 784 pixel intensities we can create graphic models for each digit by plotting the negative pixel intensity (white) and positive pixel density (black).
The below image shows each digits negative intensity in red, and positive intensity in blue.

With these weighting we can implement TensorFlows own ‘softmax’ function. The function includes a bias parameter that allows user to specify some things are more important independent of the image.
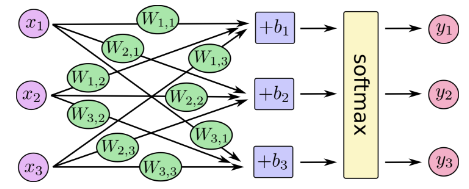
The below diagram shows the entire process from image to probability where:
x = the image, w = weighting, b = TensorFlow bias, y = probability

To get more intuition about the softmax function, check out the section on it in Michael Nielsen’s book, complete with an interactive visualization.
With TensorFlow and python installed the below few lines of code shows the implementation of the above.
import tensorflow as tf

x = tf.placeholder(tf.float32, [None, 784])
W = tf.Variable(tf.zeros([784, 10]))
b = tf.Variable(tf.zeros([10]))

y = tf.nn.softmax(tf.matmul(x, W) + b)
How accurate?
This implementation is the most basic model and only about 92% accurate. The best models in this area can get to over 99.7% accuracy — see list of results.
Sources and further reading:
Visualizing MNIST: An Exploration of Dimensionality Reduction Training a neural network on MNIST with Keras